 by excession » Tue Feb 19, 2008 11:05 pm
PokerEv Cliff Notes
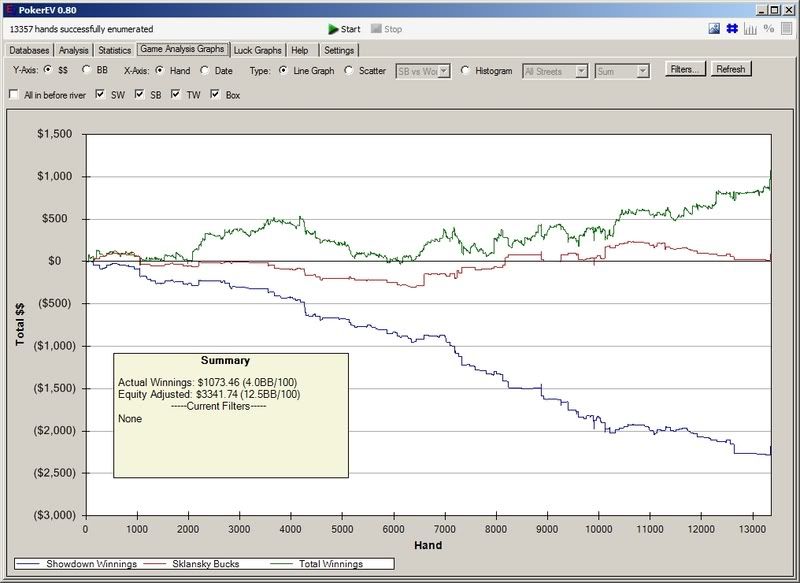
The green line represents $ won with and without seeing a showdown, the red line your expected $ won at showdown and the blue line your actual $ won at showdown.
Therefore the gap between blue and green lines shows $ won (or lost if the green is below the blue) when there was no showdown.
The gap between blue and red shows how much better than expected (or if the red is above the blue, worse than expected) you are running in hands that go to showdown.
So kotkis' graph shows a guy who when he gets to a SD tends to be behind (and at the moment he is running bad on top), but he is exerting so much pressure with his aggression that he can afford to do so because he is picking up so much in pots that never reach showdown. In fact he is the archetype of Doyle's original Supersystem strategy.
By contrast when I played short (on a site that PokerEV worked with) I was losing money in hands that didn't go to SD (hard to force folks out post-flop with 20BB's) but when I went to SD I was way ahead so I was stil comfortably up.
PokerEv probably accounts for say half the luck involved in poker. It doesn't take into account coolers (both pre-flop and on the flop) - to have some idea of that you can use set-ometer (but that still won't cover all of it). Nevertheless running pokerEV and set-ometer over your results each month will give you some idea of how close to accurate your actual win rate is likely to be.


